
Metabolic clocks, fair explanations, and a new frontier for biology and mathematics
Authors: Umberto Biccari & Enrique Zuazua
A drop of serum contains thousands of molecular signals shaped by our biology, lifestyle and the passage of time. Can Machine Learning turn this complex chemical fingerprint into a meaningful picture of how we age? And, just as importantly, can we understand and trust the answers it provides?
Addressing these questions requires more than one field of expertise. It brings geneticists, metabolomics researchers, clinicians and mathematicians into the same conversation, following a common path from biological data to predictive models, and from predictions to explanations that can be scientifically interpreted.
Want to explore the full story? Follow the journey from serum data to biological insight in our interactive notebook, where data, Machine Learning, mathematics and interpretation come together step by step.
The two papers behind this lecture
[P1] A. Ibáñez de Opakua, M. Bizkarguenaga, …, U. Biccari, R. Morales, …, E. Zuazua, J. M. Mato, Ó. Millet (multi-centre consortium), Mapping metabolic aging and disease-associated acceleration using an interpretable NMR-based clock.
[P2] U. Biccari, A. Ibáñez de Opakua, J. M. Mato, Ó. Millet, R. Morales, E. Zuazua, Fair feature attribution for multi-output prediction: a Shapley-based perspective. Manuscript PDF.
Both papers share mathematical co-authors (DeustoTech–University of Deusto, FAU Erlangen-Nürnberg, Universidad Autónoma de Madrid) and biomedical co-authors (CIC bioGUNE, ATLAS Molecular Pharma, CIBERehd). The joint venture this notebook describes already exists. Page, figure and theorem numbers refer to the manuscript versions (keep this file next to the two PDFs so that the links work).
The central message
One routine serum NMR measurement can be turned into an interpretable map of how a person’s metabolism ages, and of how each disease distorts that path. Making this map reliable, transportable and explainable is a problem that needs geneticists and mathematicians working together.
Opportunities at a glance
- A scalable molecular readout. One serum sample, measured with a standard set of NMR experiments, yields 49 quantified metabolites and 25 NMR-inferred clinical biomarkers. [P1] builds on a reference resource of 29,390 people aged 7–106 and 3,882 patients in 11 disease cohorts. NMR is reproducible, needs minimal sample preparation and suits large epidemiological studies.
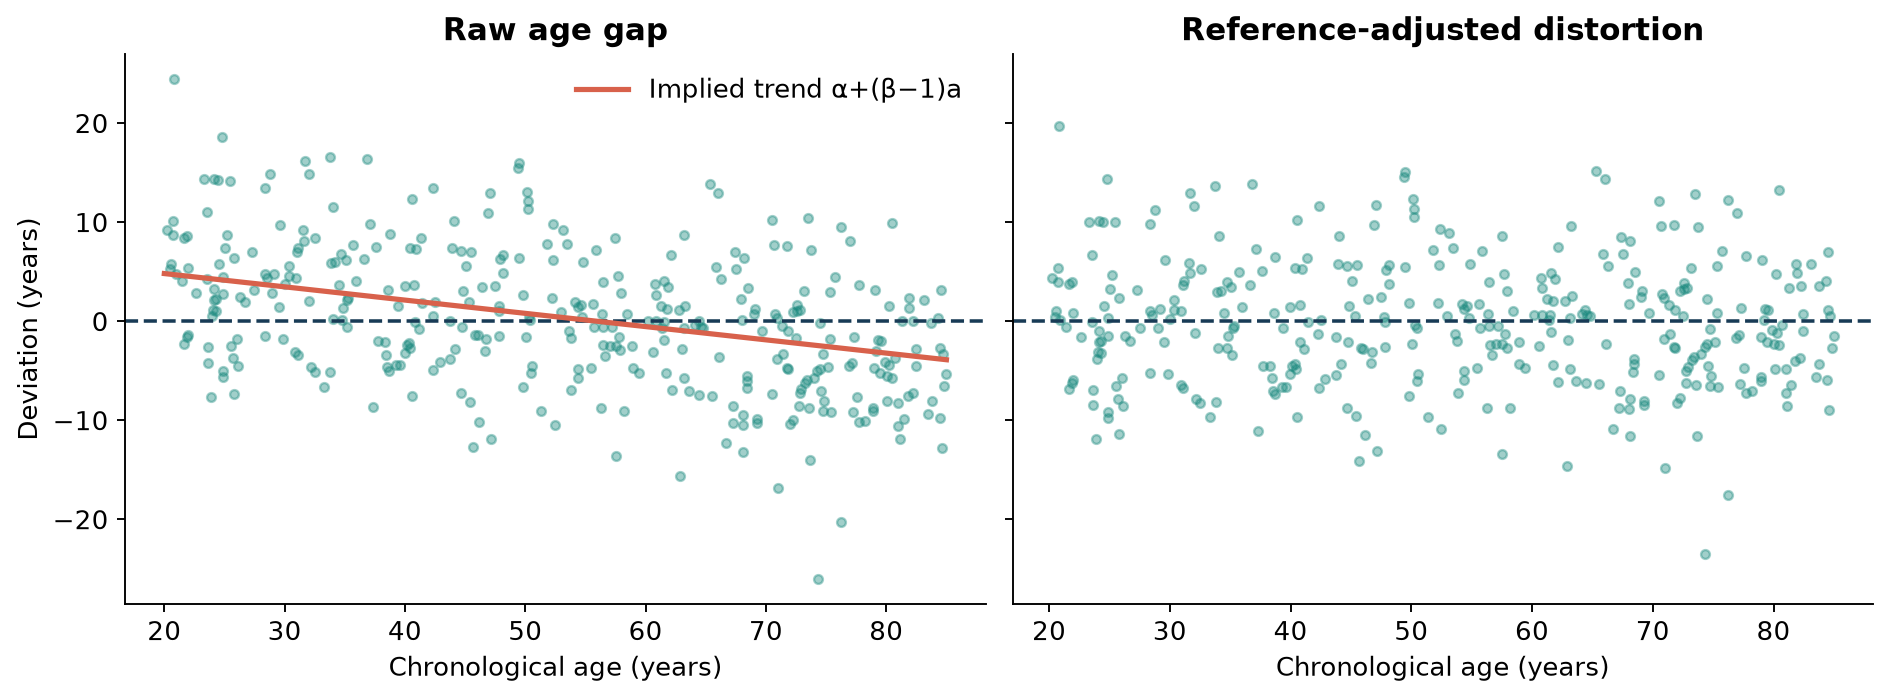
- Interpretability at a small price. Binned spectra predict age best (r = 0.93, RMSE 6.5 y) but are numerically ill-conditioned (condition number κ ≈ 15,000). The curated biomarker clock keeps r = 0.88 (RMSE 8.7 y) with κ ≈ 16, gives stable SHAP profiles, and P1 reports less regression to the mean than earlier NMR clocks. The flattening that remains is predicted by a theorem (slope = R² for an optimal clock, section 3) and is removed by the reference line.
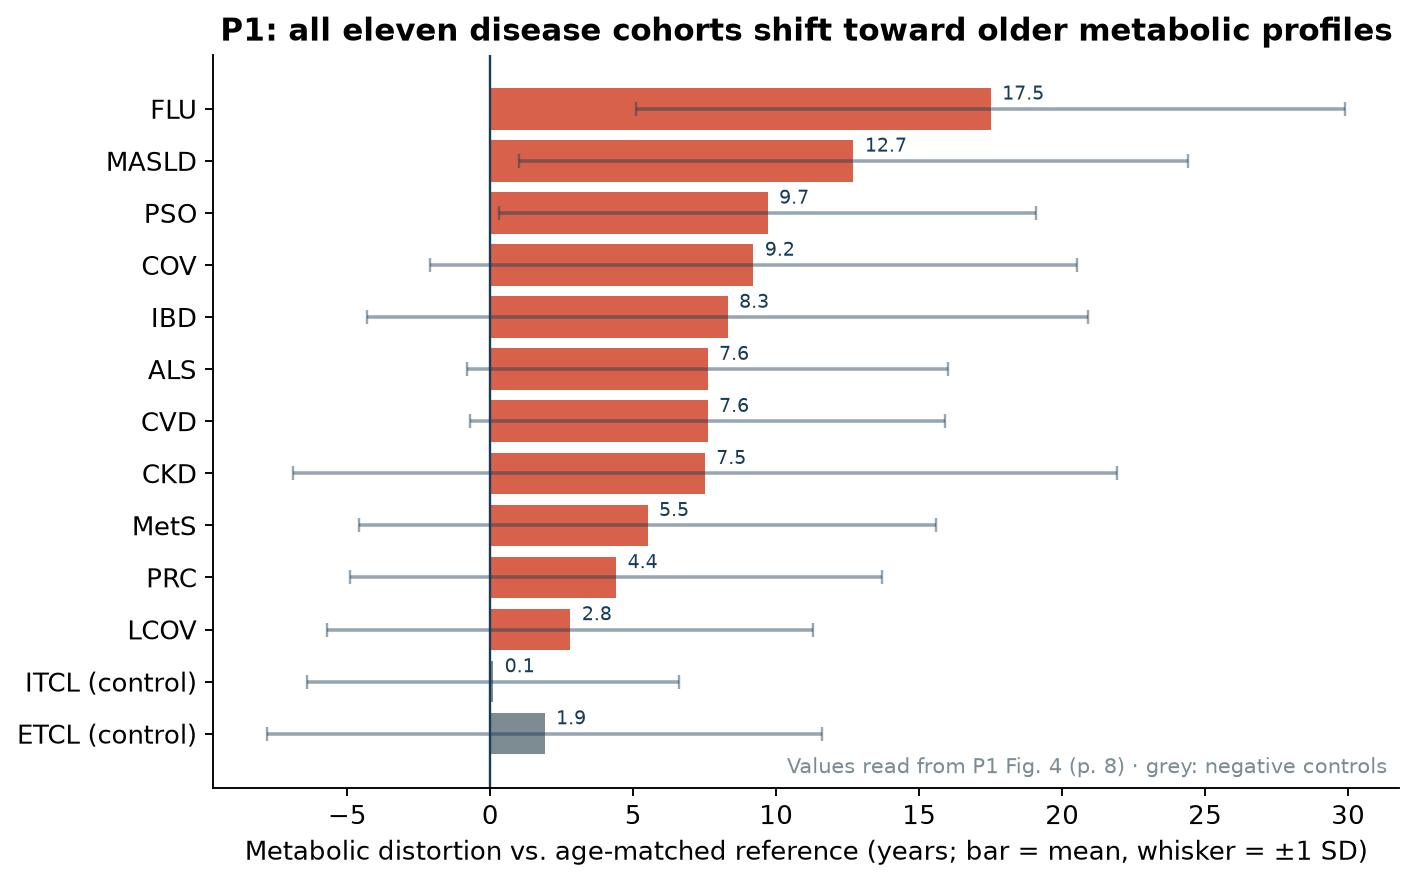
- Disease maps, not a single number. All 11 disease cohorts are shifted toward older metabolic profiles, from about 2.8 y (long COVID) to 17.5 y (influenza), while internal and external controls stay at baseline. The diseases separate along renal, inflammatory and strictly metabolic axes.
- Early warning and plasticity. People who later had a cardiovascular event already showed about 8 y of metabolic acceleration. IBD patients in remission showed about 3 y less distortion than patients with active disease
- A theorem that frees the modeller. A rigidity theorem shows that any multi-output attribution obeying the classical Shapley axioms, imposed verbatim in , must be coordinate-wise. So a shared model, which in P2’s experiment trained 2.79× faster than three separate models, can still be explained output by output, with feature-importance cosine similarity ≥ 0.974 to the separate models (an empirical finding). [P2, Thms 2.8–2.9, Tables 3–4]
- Open problems for both communities. Dynamic SHAP linked to control theory, Pareto structure of joint training, correlation-aware estimators, multi-omics integration, longitudinal and diverse cohorts.
A public introduction to the research
A birthday tells only part of the story. Two people may both be 60 years old, yet differ in physiological reserve, inflammation, kidney function, lifestyle, illness and future risk. Scientists use the expression biological age to describe this intuition: ageing is not a single process that advances at exactly the same pace in every body.
One promising window into this variation is a serum sample. Nuclear magnetic resonance (NMR) can measure a broad metabolic profile from blood with little sample preparation. With machine learning, that profile can be used to estimate the chronological ages most often associated with similar profiles in a reference population.
That estimate is called a metabolic clock. Its value is not that it declares how old someone “really” is. Its value is that it turns a complex molecular profile into a reproducible research phenotype that can be compared across health, disease and time.
[P1] developed an interpretable NMR-based metabolic clock using a reference resource of 29,390 people aged 7–106, alongside 3,882 patients across 11 disease cohorts. Rather than relying only on a dense spectrum, the study used a curated set of metabolites and NMR-inferred clinical biomarkers. This sacrifices some raw predictive accuracy, but makes the model more stable and more interpretable.The study reported that the curated clock predicted chronological age with a correlation of 0.88 and a typical error of 8.7 years. A spectrum-based model predicted age more closely, but was much more numerically unstable. In a field where scientists need to ask which measurements are driving a result?, that trade-off matters.
The research also reported that all 11 disease cohorts had metabolic profiles shifted toward older values relative to their chronological age. The size and character of that shift differed by cohort. The study describes patterns linked to renal function, inflammation and metabolism—not one universal “disease signal.”
The essential caution: an age gap is not automatically accelerated ageing
It is tempting to subtract chronological age from predicted age and call the result an “age gap.” But this simple calculation can be misleading.
Age-prediction models naturally tend to pull estimates toward the average age represented in their training data. As a result, younger people can be predicted somewhat older and older people somewhat younger even when there is no disease, intervention or meaningful biological acceleration. This is a statistical effect known as regression to the mean.
For that reason, the researchers distinguish a raw age gap from a reference-adjusted distortion: the difference between a person’s clock output and the output expected for people of the same chronological age in an independent reference population. The correction does not prove biological validity; it prevents a predictable statistical artefact from being mistaken for one.
Why explanations matter as much as predictions
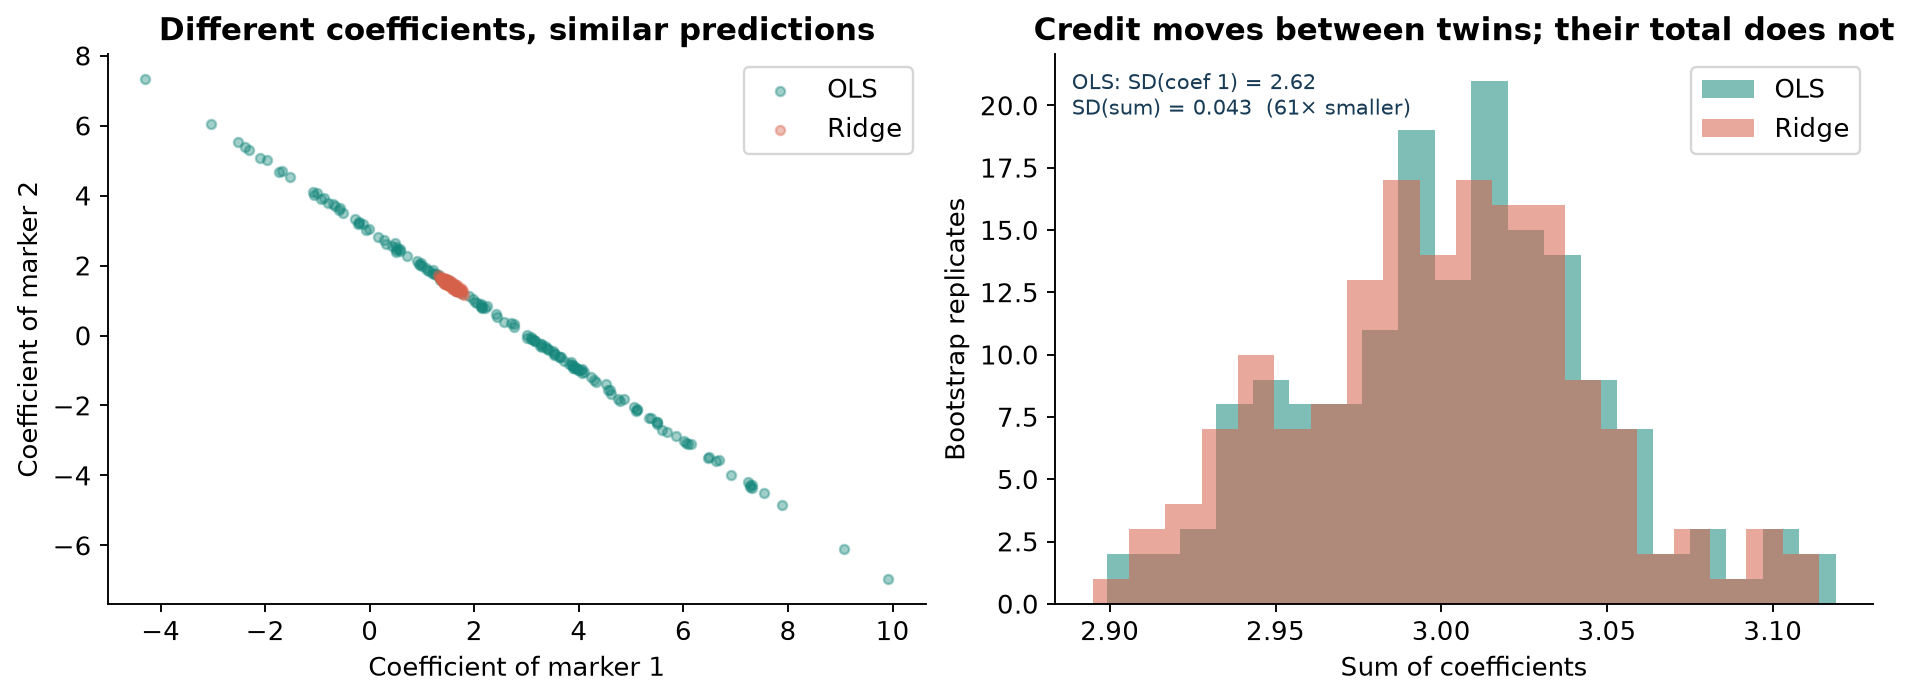
Biological measurements travel in groups. Neighboring regions of an NMR spectrum, for example, can carry overlapping information. A model may predict well while distributing “importance” across those correlated features in unstable ways.
This is why [P1] favored biologically curated measurements: a model that is a little less accurate but whose explanations remain stable can be more useful for science. It gives researchers hypotheses they can inspect, challenge and test in the laboratory.
One widely used explanation method is based on the Shapley value, a mathematical rule originally developed to allocate a shared reward fairly among contributors. In machine learning, it estimates how much each feature contributes to a particular prediction.
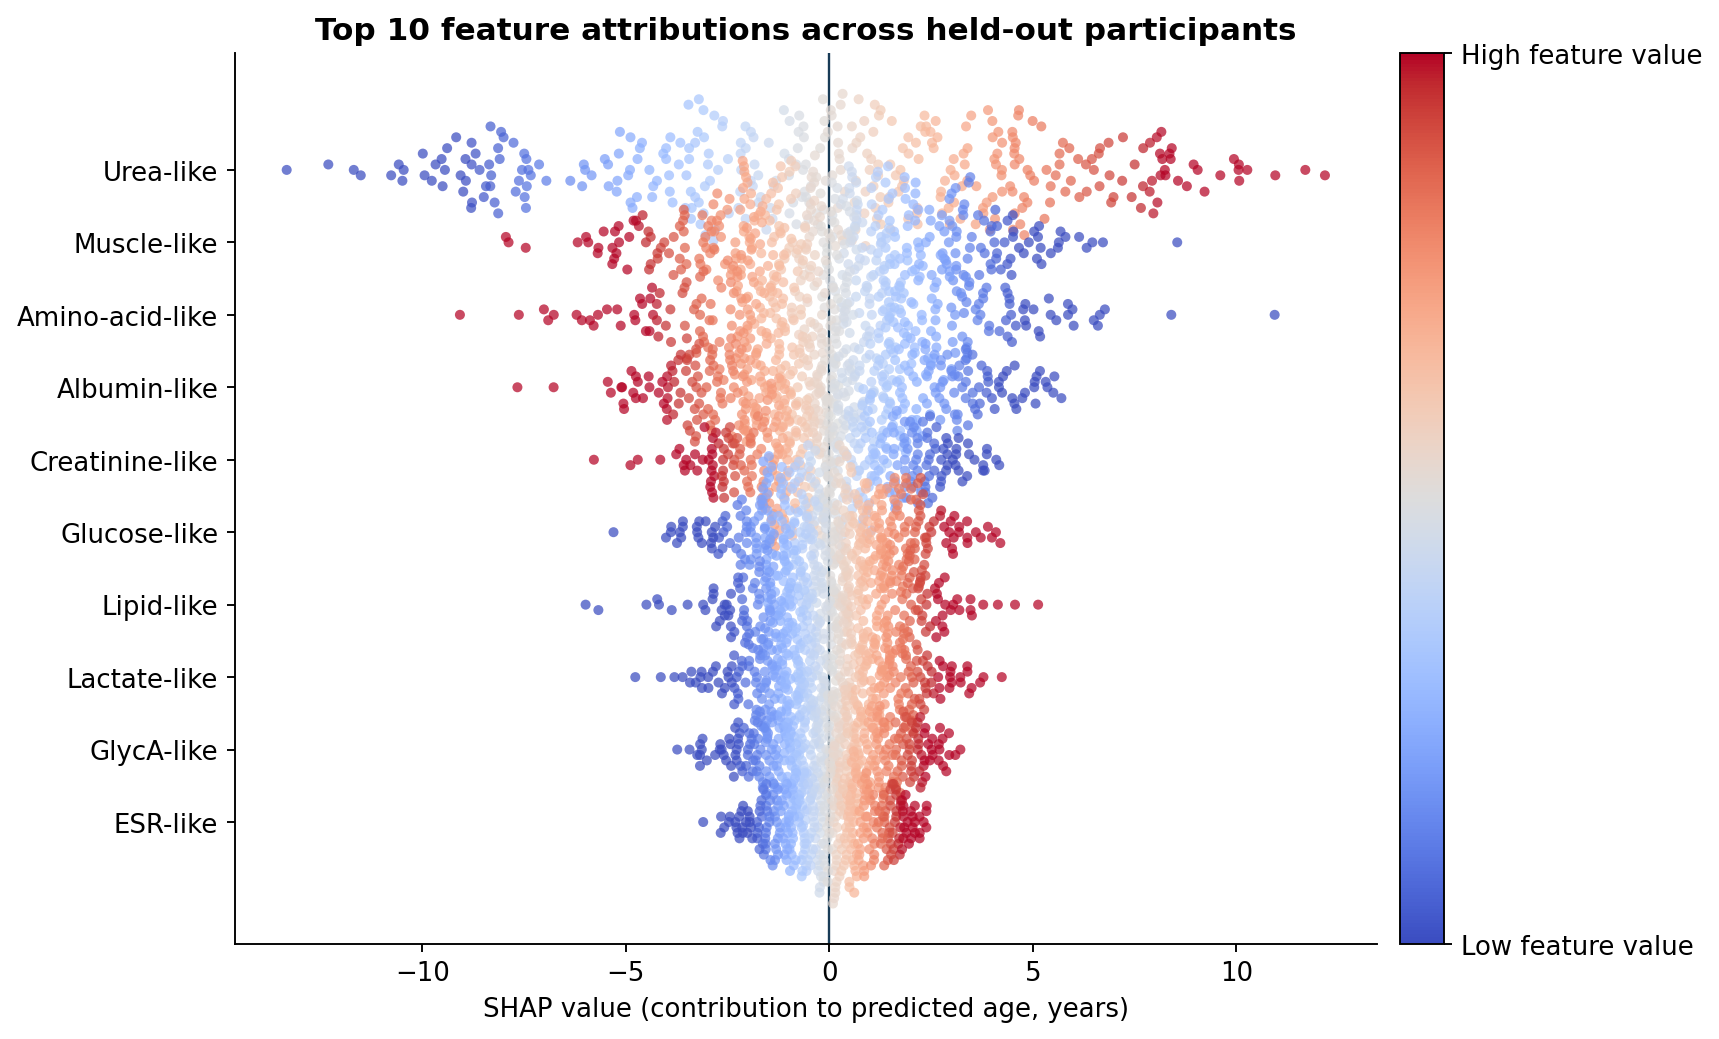
Our companion study [P2] examined what happens when one model predicts several related outcomes at once. It proved that, under the standard fairness principles extended directly to multiple outputs, the only possible attribution rule is to explain each output coordinate by coordinate. This is reassuring: a shared model can be efficient, while each prediction can still receive a clear, separately interpretable explanation.
What this could make possible
Metabolic clocks may help researchers:
- study how molecular ageing patterns differ between populations and diseases;
- identify metabolic pathways for experimental follow-up;
- connect metabolomic profiles with genetics, methylation and gene expression;
- investigate whether changes over time track recovery, resilience or future outcomes; and
- design more interpretable machine-learning tools for biomedicine.
These are research opportunities, not established clinical uses. Before a clock can support personal medical decisions, it must be tested prospectively, across diverse populations, in realistic clinical settings, and against outcomes that matter to patients.
What remains unknown
The central scientific question is still open: does a clock estimate a mechanism of ageing, or does it capture a useful but partial statistical signature of age, health and disease?
The current evidence is predominantly associative and comes from a reference population that was mainly Caucasian. Medication, nutrition, laboratory procedures and population differences can also influence metabolic profiles. A prediction score alone cannot settle questions of cause, individual prognosis or treatment benefit.
The next frontier is therefore not merely a more accurate clock. It is a clock that is transportable, calibrated, explainable and linked to meaningful longitudinal outcomes.