
Authors: Umberto Biccari
An accurate prediction does not reveal the path that produced it. Consider a Transformer that predicts biological age from clinical measurments. A blood panel goes in, an age estimate comes out, and in between the model builds up a tangle of interactions across every layer, one that grows harder to inspect the deeper it goes. A critical question is left unanswered: what is the model actually doing with the measurements you feed it? Which biomarkers become the network’s messengers and which stay on the sidelines? Answering that – not just what the model predicts, but how it gets there – is the problem of interior interpretability.
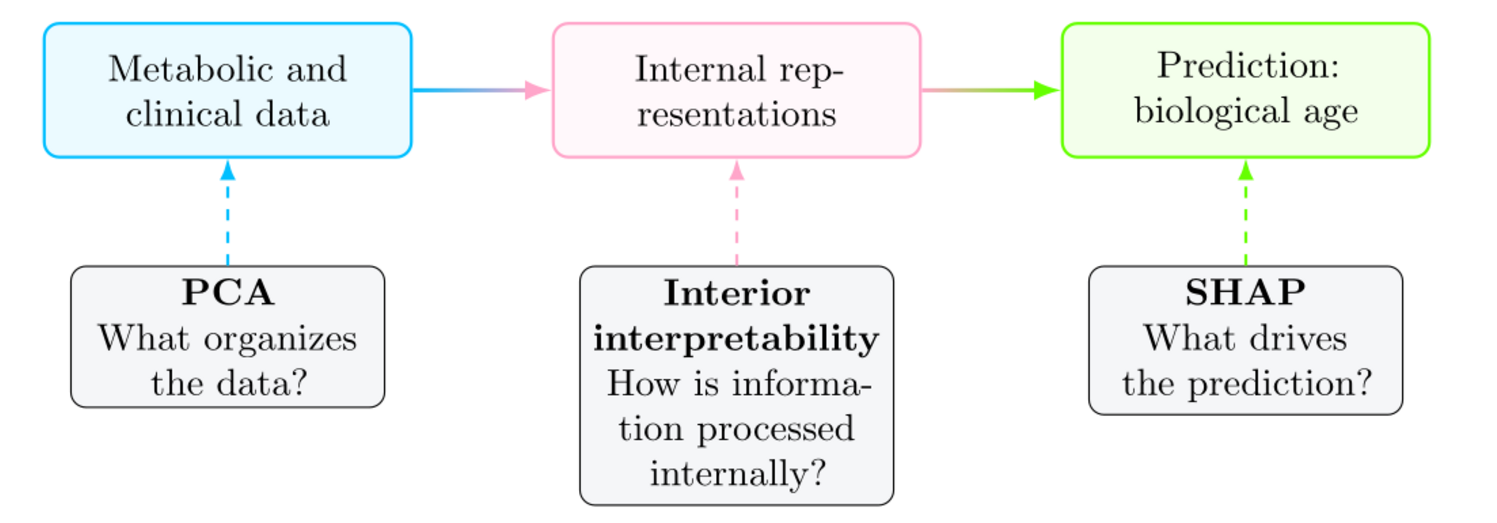
Those questions concern the journey between measurement and estimate, but familiar interpretability tools tend to examine one endpoint or the other. Principal Component Analysis (PCA) reveals broad patterns among the input measurements, while attribution methods like SHAP identifies which inputs contribute to the final prediction [4]. Interior interpretability [2] fills the gap between them by tracing how variables carry and reorganize information across the model’s layers. Figure 1 summarizes these complementary viewpoints: a measurement may help structure the data, become an influential messenger inside the network, or strongly affect the final prediction, and it need not do all three. The mathematical tool that makes the middle viewpoint precise is decades old: Markov-chain contraction theory from the 1950s, repurposed for attention.
Following the conversation
In a tabular Transformer, every biomarker is represented as a token. At each layer, the attention matrix assigns weights that describe how each token gathers information from the others. Rows receive; columns supply. A single layer captures only one moment in this process. Across depth, however, the interactions develop into a longer conversation.
Imagine scientists passing notes around a room. At first, each scientist hears directly from only a few colleagues. After many rounds, however, information from one participant has travelled through several intermediaries. Eventually everyone may have heard nearly the same mixture of the conversation, even though some voices contributed much more than others.
Attention shows who listens to whom in one layer; attention rollout [1] stitches these layer-by-layer snapshots together, revealing how each voice can travel through the whole network. The result is one global map of the pathways created across the model’s depth. This stitching works because each layer describes one step in the journey. Combining these steps reveals longer pathways through intermediate measurements and across multiple layers. The map reveals which measurements have limited reach and which spread their influence widely through the network. Rollout does not establish that a variable causally determines the prediction. It is a diagnostic of the routes that attention makes available for internal exchange, complementing attribution and intervention-based methods.
Many exchanges become one pattern
One might expect repeated exchanges to produce an increasingly tangled map. Instead, depth has an organizing effect. As the exchanges accumulate, different tokens draw on increasingly similar mixtures of information, and the network gradually settles on one common pattern of information flow.
Figure 2 shows this effect directly. The intricate rollout map and its single-profile approximation are almost indistinguishable, while the two measures of their remaining differences rapidly approach zero as layers are added.
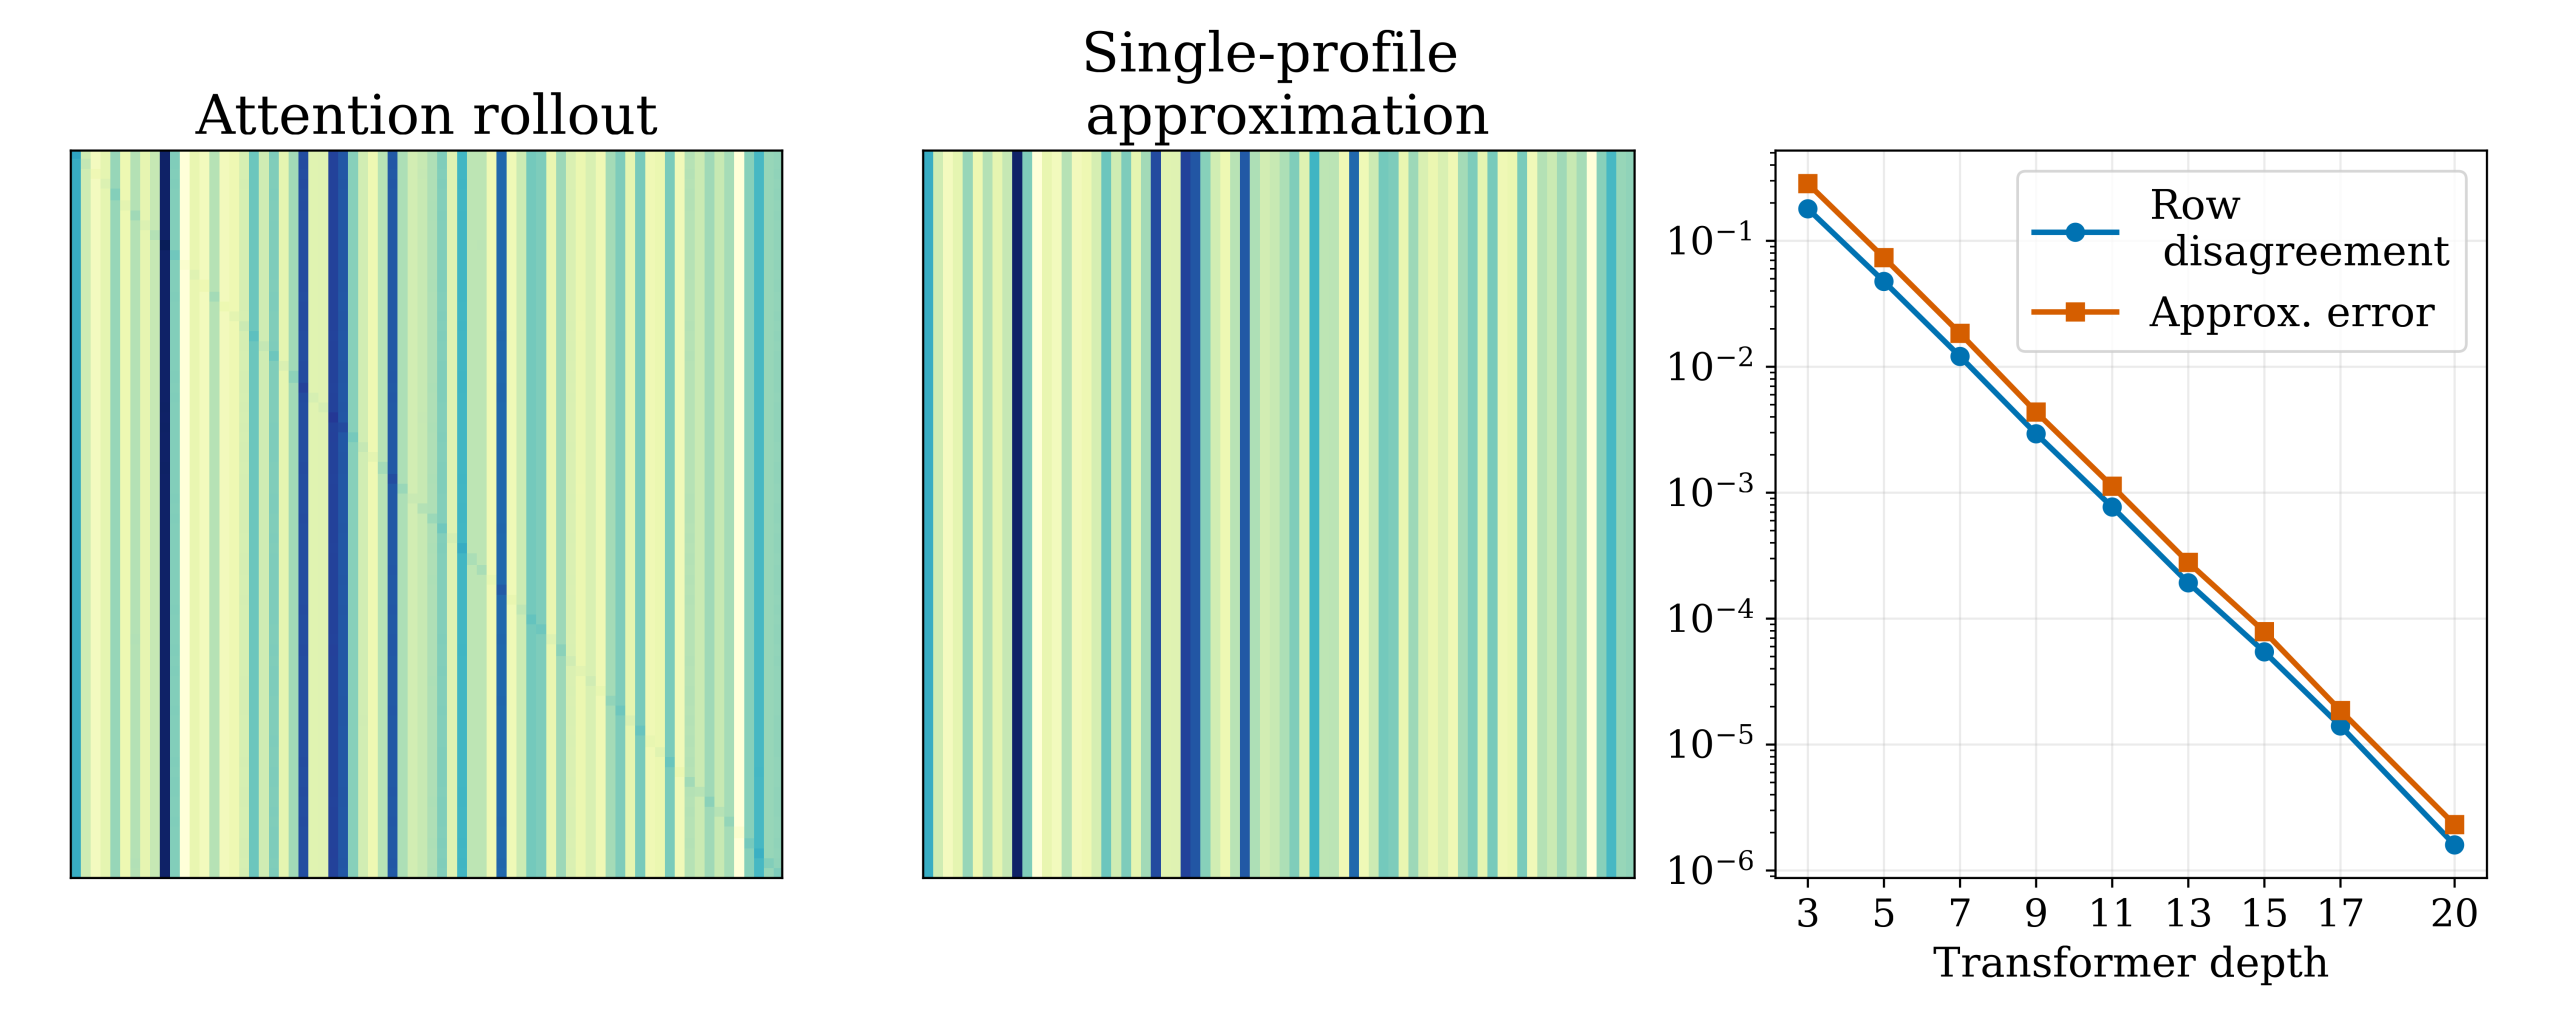
A map in which every row follows the same pattern has rank one: the rollout map approaches this structure as depth increases. But why does this happen, and what determines which measurements dominate that pattern?
The answer lies in the repeated overlap between exchanges. At every layer, different tokens listen partly to the same sources, making the information they receive a little more alike. The residual connection preserves part of the previous pattern, so this change is gradual rather than abrupt. Repeated layer after layer, the process steadily washes out the remaining differences. The Dobrushin coefficient [3], a classical tool from Markov-chain theory, provides a precise way to measure this convergence.
But settling on a common pattern does not make all measurements equally important. Some voices can still dominate the conversation while others remain faint. Training determines this balance: as the model learns, it reshapes the shared pattern and gives certain measurements a more central role in its internal flow.
Bringing the three views together
Once training has shaped the common profile, rollout can identify which measurements become most central inside the network. By adding up how strongly each measurement supplies information, rollout provides a ranking of internal prominence. Comparing this ranking with PCA and SHAP brings together the three viewpoints introduced in Figure 1: structure in the input data, flow through the model, and contribution to the final prediction.
Figure 3 presents a representative comparison for a biomedical dataset used to estimate biological age. It shows the six highest-ranked measurements under PCA, rollout, and SHAP.
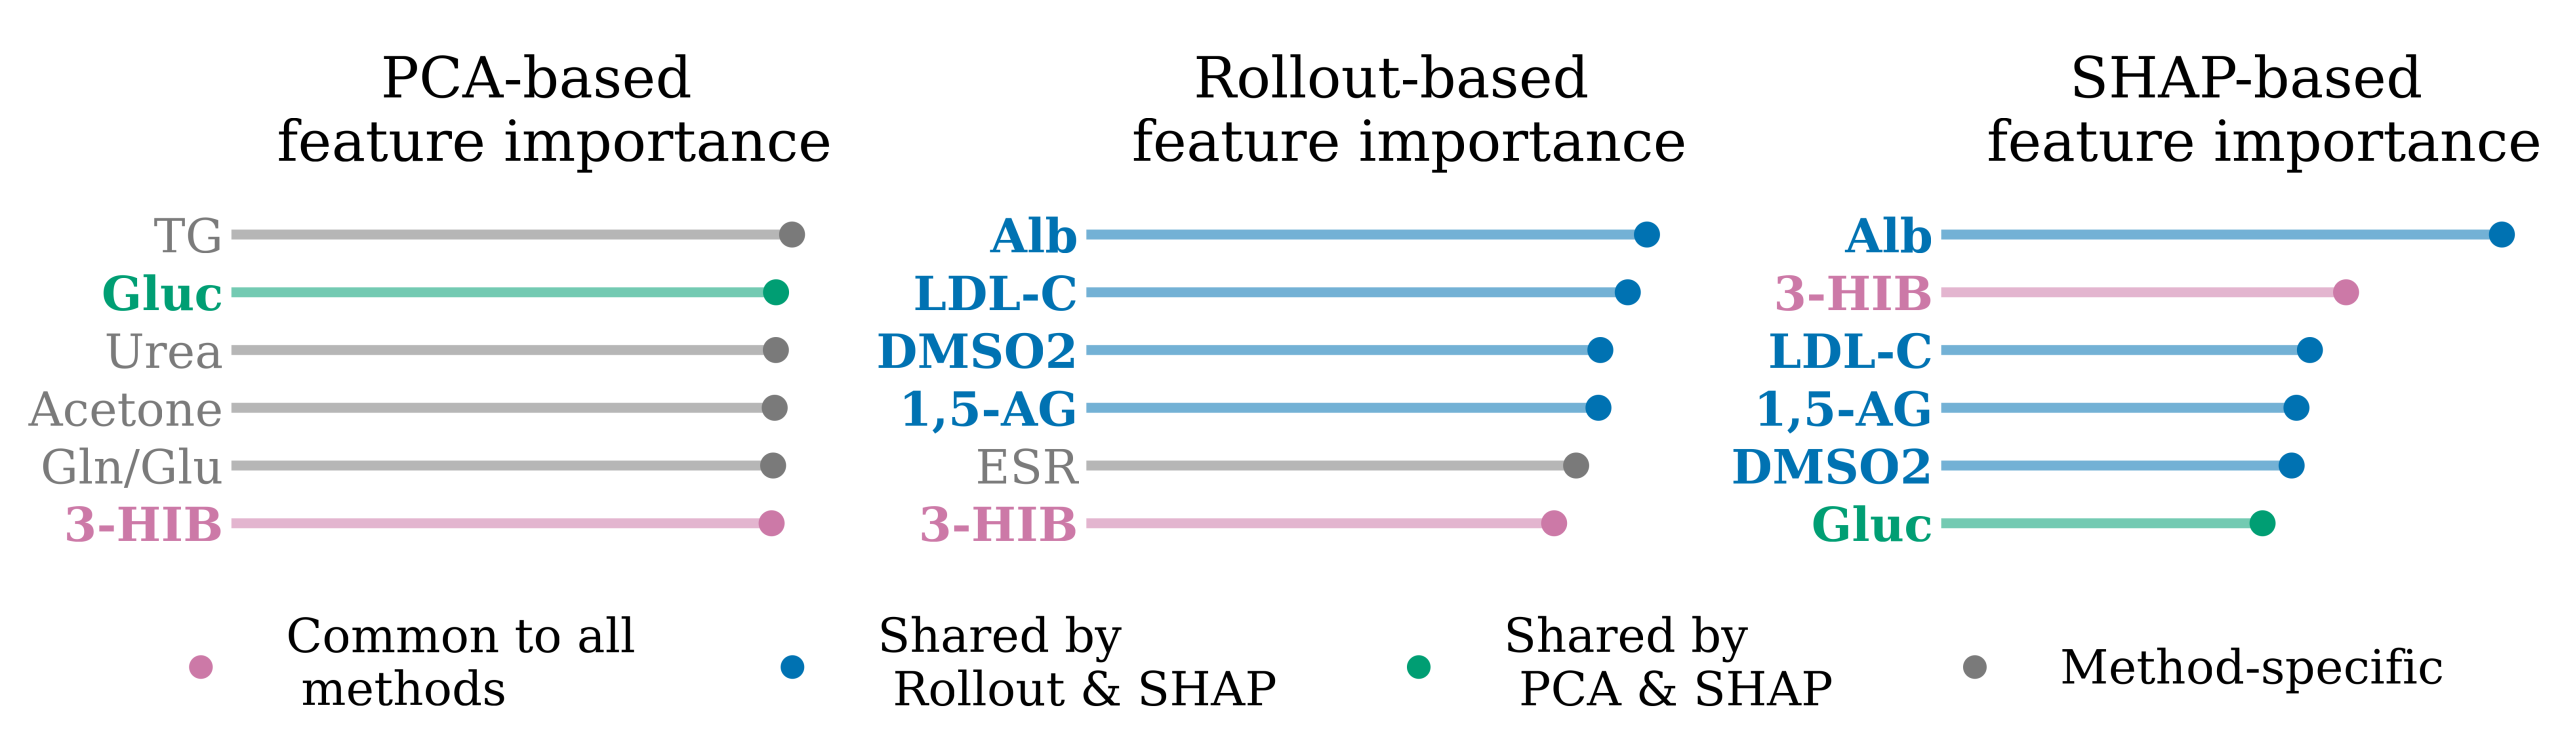
The value of rollout is that it adds the missing middle to this biological story. PCA emphasizes measurements that organize the original data, many of which are not known drivers of aging. As information moves through the trained network, rollout shifts prominence toward established indicators of biological age. At the top of the ranking, SHAP largely preserves this new ordering, so rollout acts as a bridge between the structure of the input data and the variables that shape the age estimate.
This is the perspective that interior interpretability adds: it reveals how the roles of individual measurements are reorganized between the input data and the final prediction.
The path matters
That a tool from 1950s Markov-chain theory can reveal structure inside a Transformer is more than a historical curiosity. It suggests that even complex neural networks may contain forms of organization that classical mathematics can expose. Attention rollout is not a causal or complete explanation, but it turns part of the model’s hidden computation into something that can be measured, compared, and questioned. The broader opportunity is to use this mathematical structure not only to diagnose trained networks, but eventually to compare, control, and design how information moves inside them.
References
- S. Abnar and W. Zuidema, “Quantifying attention flow in Transformers,” Proceedings of the 58th Annual Meeting of the Association for Computational Linguistics, 4190–4197, 2020.
- U. Biccari, Q. Huang, and E. Zuazua, “Interior interpretability with attention rollout: contraction and propagation profiles in Transformers,” preprint, arXiv 2607.22367, 2026.
- R. L. Dobrushin, “Central Limit Theorem for nonstationary Markov chains. I,” Theory of Probability and Its Applications, 1, 65-80, 1956.
- S. M. Lundberg and S.-I. Lee, “A unified approach to interpreting model predictions,” Advances in Neural Information Processing Systems, 30, 2017.